A historical timelapse showing the development of Lisbon from its early settlements to the present day. The animation covers the city's Roman, Visigothic, Islamic and Portuguese periods, showing how Lisbon grew, changed and was rebuilt over time.
It also illustrates major events such as the earthquakes, tsunami and fire that affected the city, as well as the subsequent reconstruction and urban development.
The animation combines historical events, population growth and the expansion of the city to provide a visual overview of Lisbon's history.
Created by Latos Charts. Thank you for creating and sharing this excellent work.
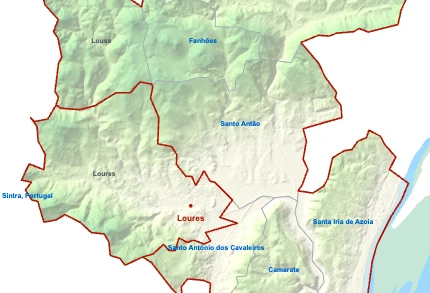
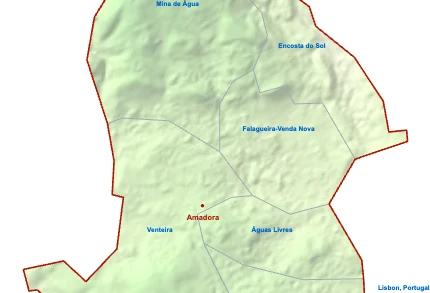
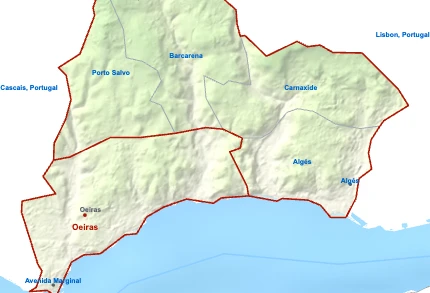
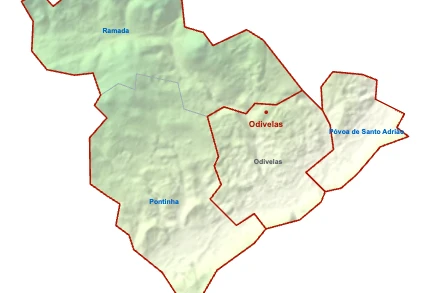
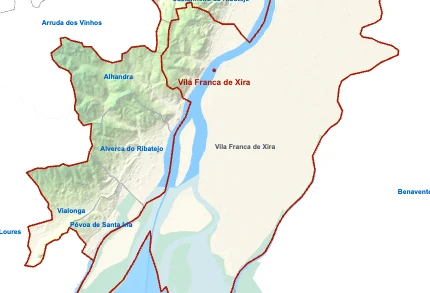
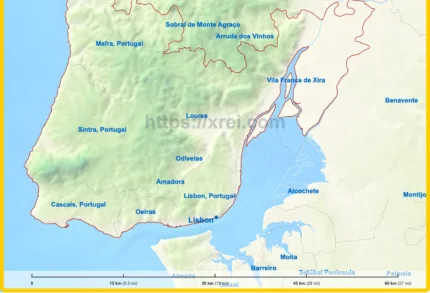
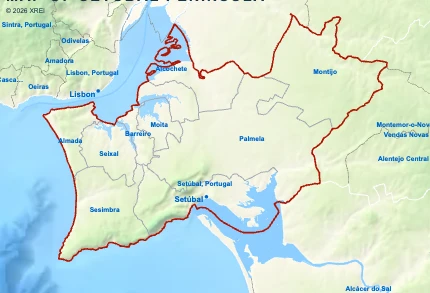
Municipalities of Greater Lisbon map
015 km (9.3 mi)30 km (19 mi)45 km (28 mi)60 km (37 mi)
Height
080200400524 m
02626561 3101 720 ft
0 m (0 ft), 80 m (262 ft), 200 m (656 ft), 400 m (1310 ft), Max altitude 524 m (1720 ft)
Sea depth
01506001 8003 2005 200+ m
04921 9705 91010 50017 060+ ft
0 m (0 ft), 150 m (492 ft), 600 m (1970 ft), 1800 m (5910 ft), 3200 m (10500 ft), deeper than 5200 m (17060 ft)